import requestsimport urllib3urllib3.disable_warnings()def fetch_uniprot_data(uniprot_id): url =f"https://rest.uniprot.org/uniprotkb/{uniprot_id}.json" response = requests.get(url, verify=False) # Disable SSL verification response.raise_for_status() # Raise an error for bad status codesreturn response.json()def display_uniprot_data(data): primary_accession = data.get('primaryAccession', 'N/A') protein_name = data.get('proteinDescription', {}).get('recommendedName', {}).get('fullName', {}).get('value', 'N/A') gene_name = data.get('gene', [{'geneName': {'value': 'N/A'}}])[0]['geneName']['value'] organism = data.get('organism', {}).get('scientificName', 'N/A') function_comment =next((comment for comment in data.get('comments', []) if comment['commentType'] =="FUNCTION"), None) function = function_comment['texts'][0]['value'] if function_comment else'N/A'# Printing the dataprint(f"UniProt ID: {primary_accession}")print(f"Protein Name: {protein_name}")print(f"Organism: {organism}")print(f"Function: {function}")# Replace this with the UniProt ID you want to fetchuniprot_id ="P04234"data = fetch_uniprot_data(uniprot_id)display_uniprot_data(data)
UniProt ID: P04234
Protein Name: T-cell surface glycoprotein CD3 delta chain
Organism: Homo sapiens
Function: Part of the TCR-CD3 complex present on T-lymphocyte cell surface that plays an essential role in adaptive immune response. When antigen presenting cells (APCs) activate T-cell receptor (TCR), TCR-mediated signals are transmitted across the cell membrane by the CD3 chains CD3D, CD3E, CD3G and CD3Z. All CD3 chains contain immunoreceptor tyrosine-based activation motifs (ITAMs) in their cytoplasmic domain. Upon TCR engagement, these motifs become phosphorylated by Src family protein tyrosine kinases LCK and FYN, resulting in the activation of downstream signaling pathways (PubMed:2470098). In addition of this role of signal transduction in T-cell activation, CD3D plays an essential role in thymocyte differentiation. Indeed, participates in correct intracellular TCR-CD3 complex assembly and surface expression. In absence of a functional TCR-CD3 complex, thymocytes are unable to differentiate properly. Interacts with CD4 and CD8 and thus serves to establish a functional link between the TCR and coreceptors CD4 and CD8, which is needed for activation and positive selection of CD4 or CD8 T-cells (PubMed:12215456)
More information:
AlphaFold model
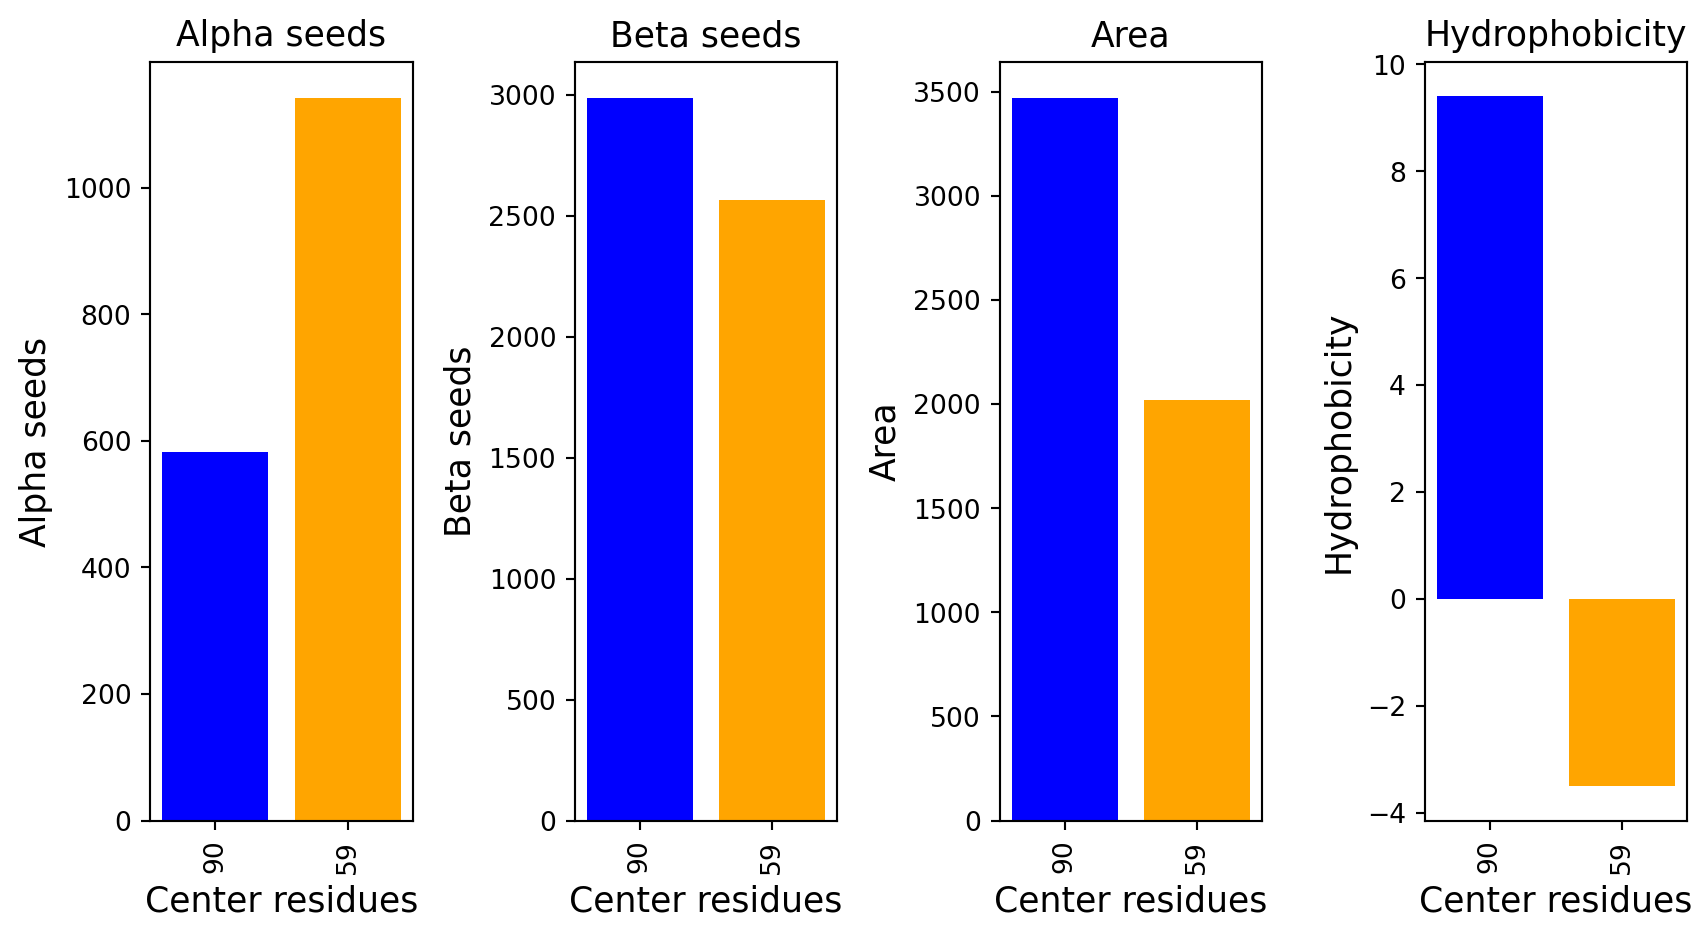
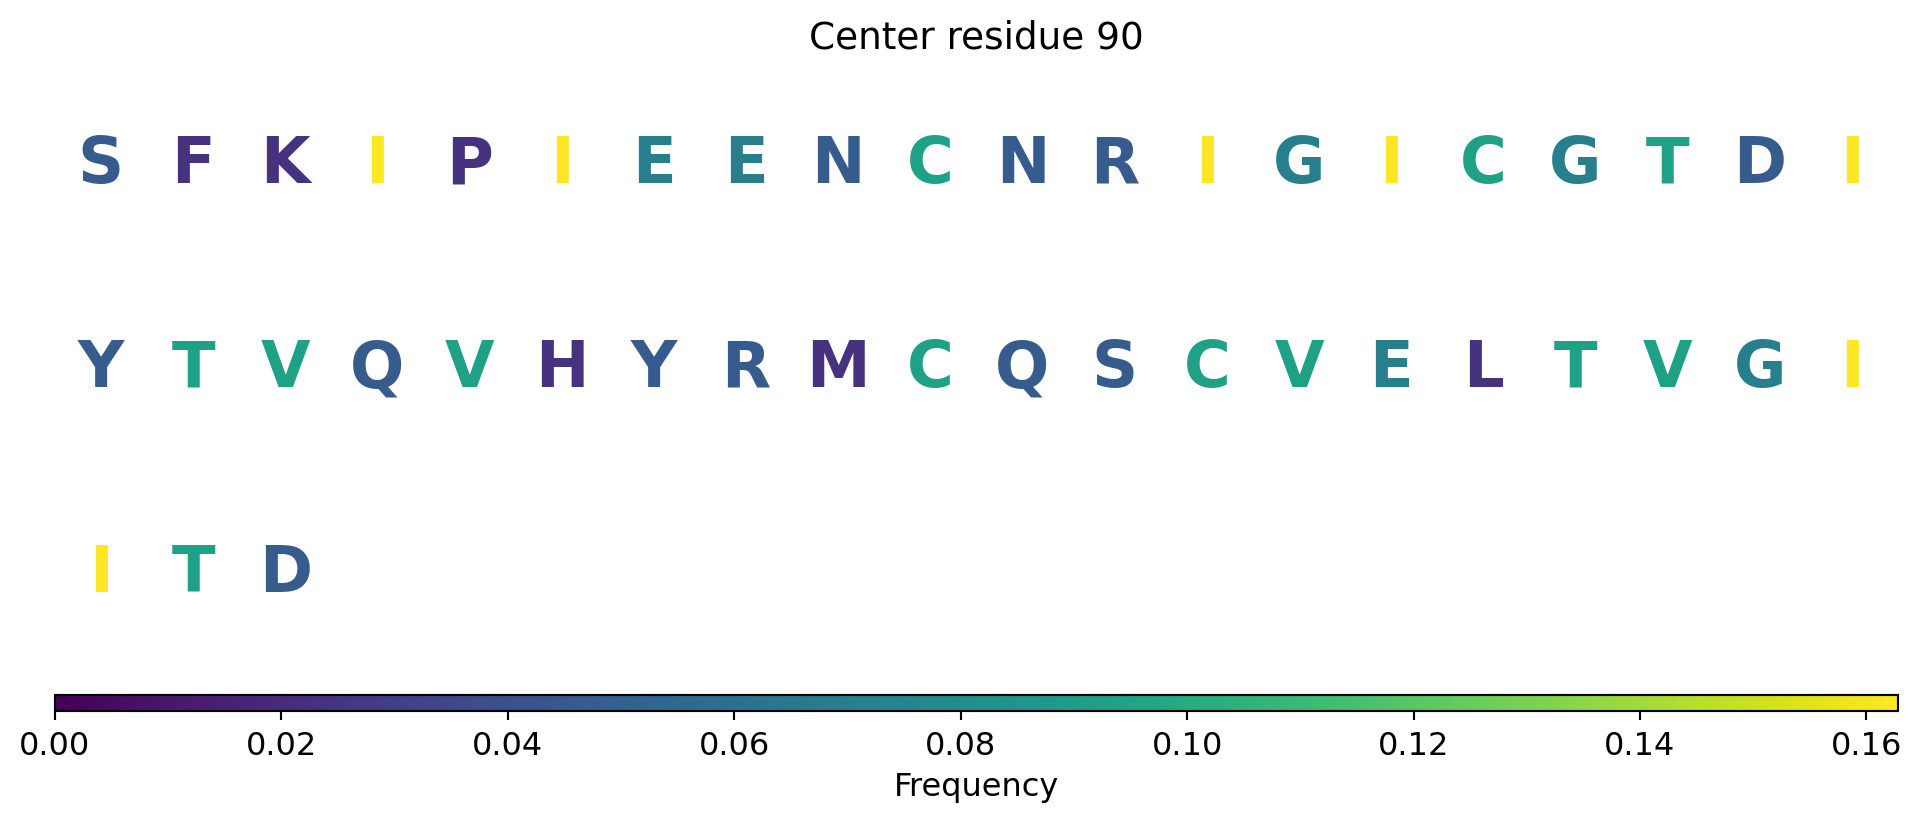
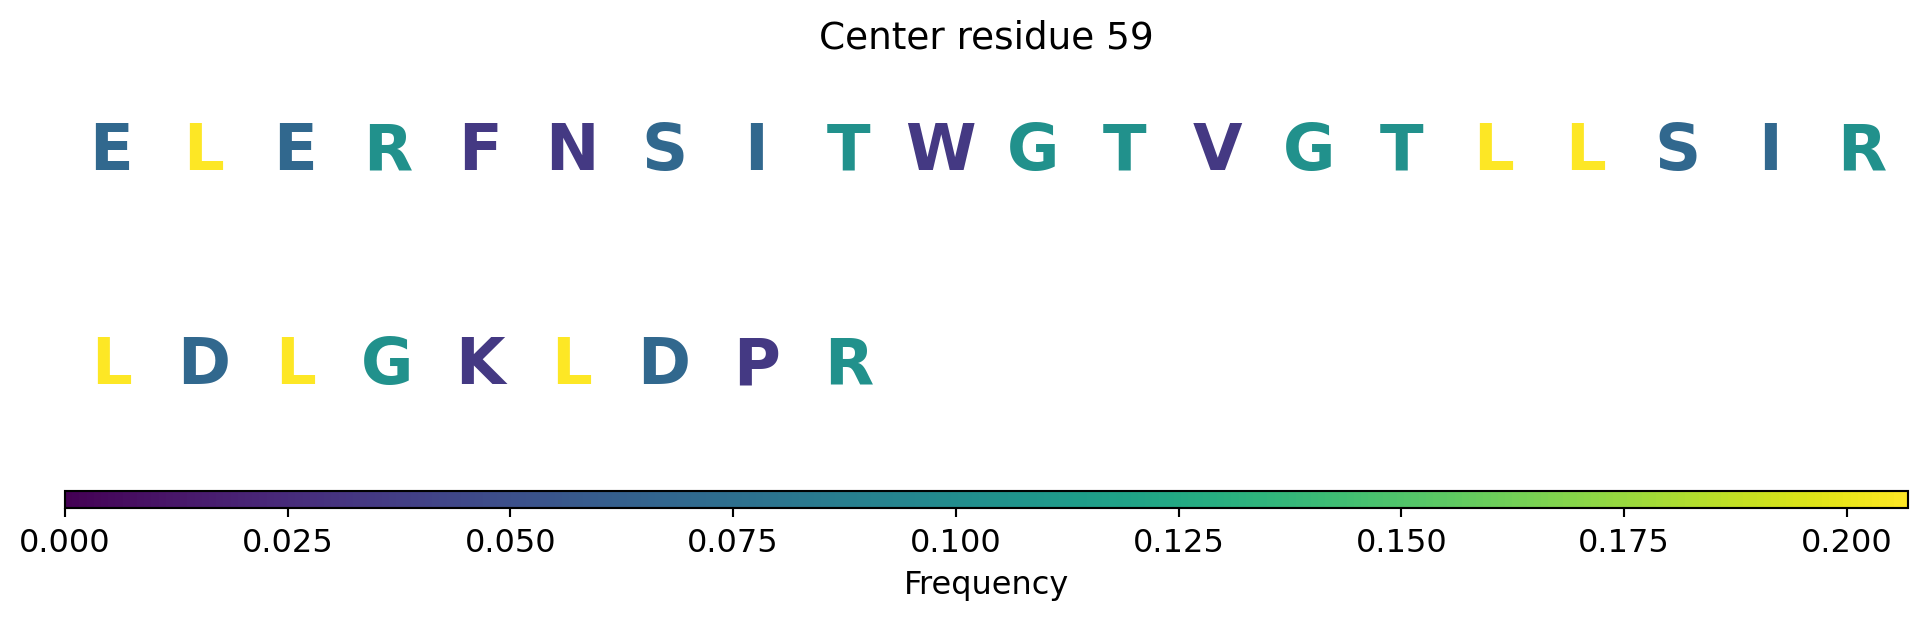
Surface representation - binding sites
The computed point cloud for pLDDT > 0.6. Each atom is sampled on average by 10 points.
To see the predicted binding interfaces, you can choose color theme “uncertainty”.
Go to the “Controls Panel”
Below “Components”, to the right, click on “…”
“Set Coloring” by “Atom Property”, and “Uncertainty/Disorder”