import requestsimport urllib3urllib3.disable_warnings()def fetch_uniprot_data(uniprot_id): url =f"https://rest.uniprot.org/uniprotkb/{uniprot_id}.json" response = requests.get(url, verify=False) # Disable SSL verification response.raise_for_status() # Raise an error for bad status codesreturn response.json()def display_uniprot_data(data): primary_accession = data.get('primaryAccession', 'N/A') protein_name = data.get('proteinDescription', {}).get('recommendedName', {}).get('fullName', {}).get('value', 'N/A') gene_name = data.get('gene', [{'geneName': {'value': 'N/A'}}])[0]['geneName']['value'] organism = data.get('organism', {}).get('scientificName', 'N/A') function_comment =next((comment for comment in data.get('comments', []) if comment['commentType'] =="FUNCTION"), None) function = function_comment['texts'][0]['value'] if function_comment else'N/A'# Printing the dataprint(f"UniProt ID: {primary_accession}")print(f"Protein Name: {protein_name}")print(f"Organism: {organism}")print(f"Function: {function}")# Replace this with the UniProt ID you want to fetchuniprot_id ="Q6ZMI3"data = fetch_uniprot_data(uniprot_id)display_uniprot_data(data)
UniProt ID: Q6ZMI3
Protein Name: Gliomedin
Organism: Homo sapiens
Function: Ligand for NRCAM and NFASC/neurofascin that plays a role in the formation and maintenance of the nodes of Ranvier on myelinated axons. Mediates interaction between Schwann cell microvilli and axons via its interactions with NRCAM and NFASC. Nodes of Ranvier contain clustered sodium channels that are crucial for the saltatory propagation of action potentials along myelinated axons. During development, nodes of Ranvier are formed by the fusion of two heminodes. Required for normal clustering of sodium channels at heminodes; not required for the formation of mature nodes with normal sodium channel clusters. Required, together with NRCAM, for maintaining NFASC and sodium channel clusters at mature nodes of Ranvier
More information:
AlphaFold model
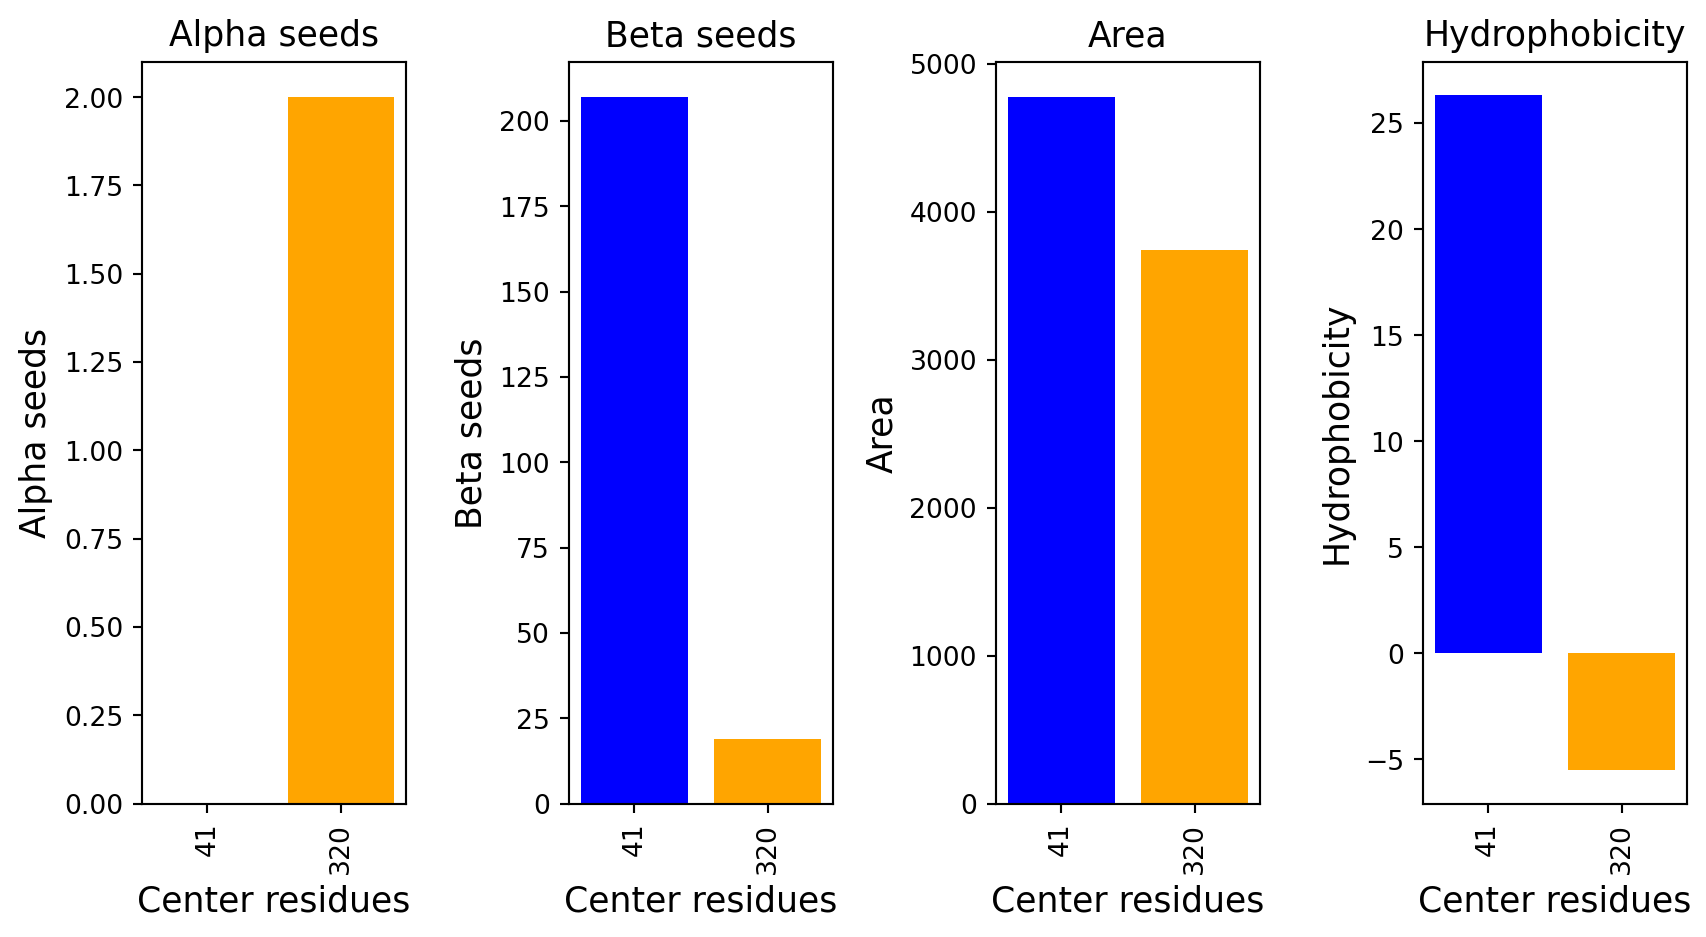
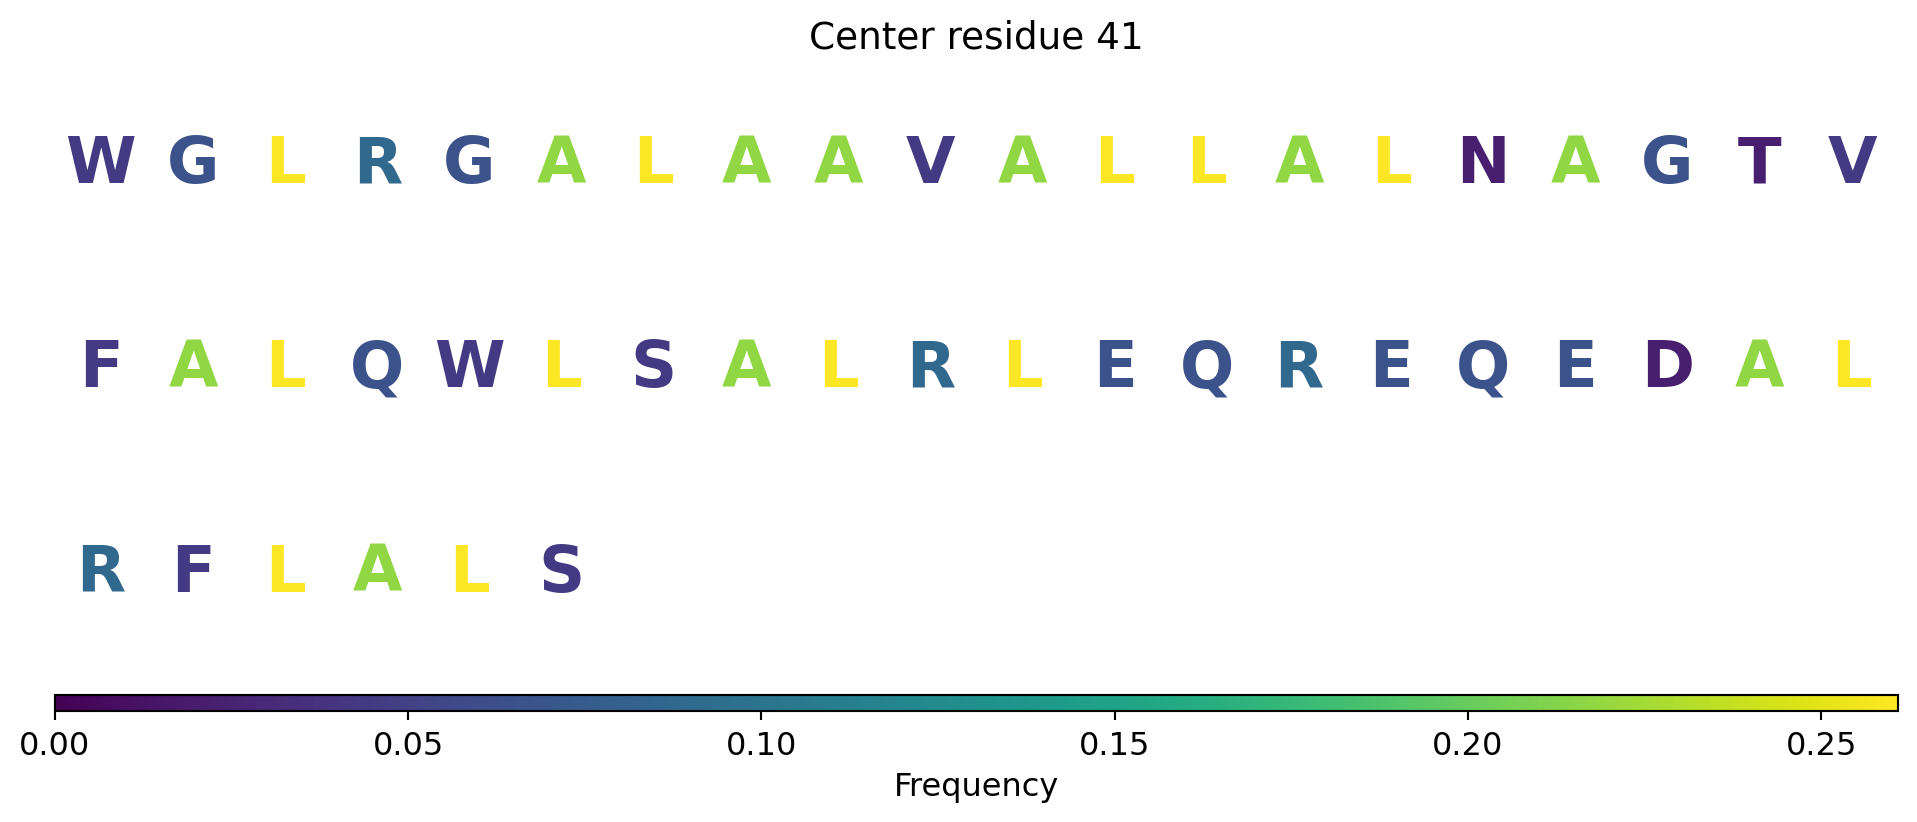
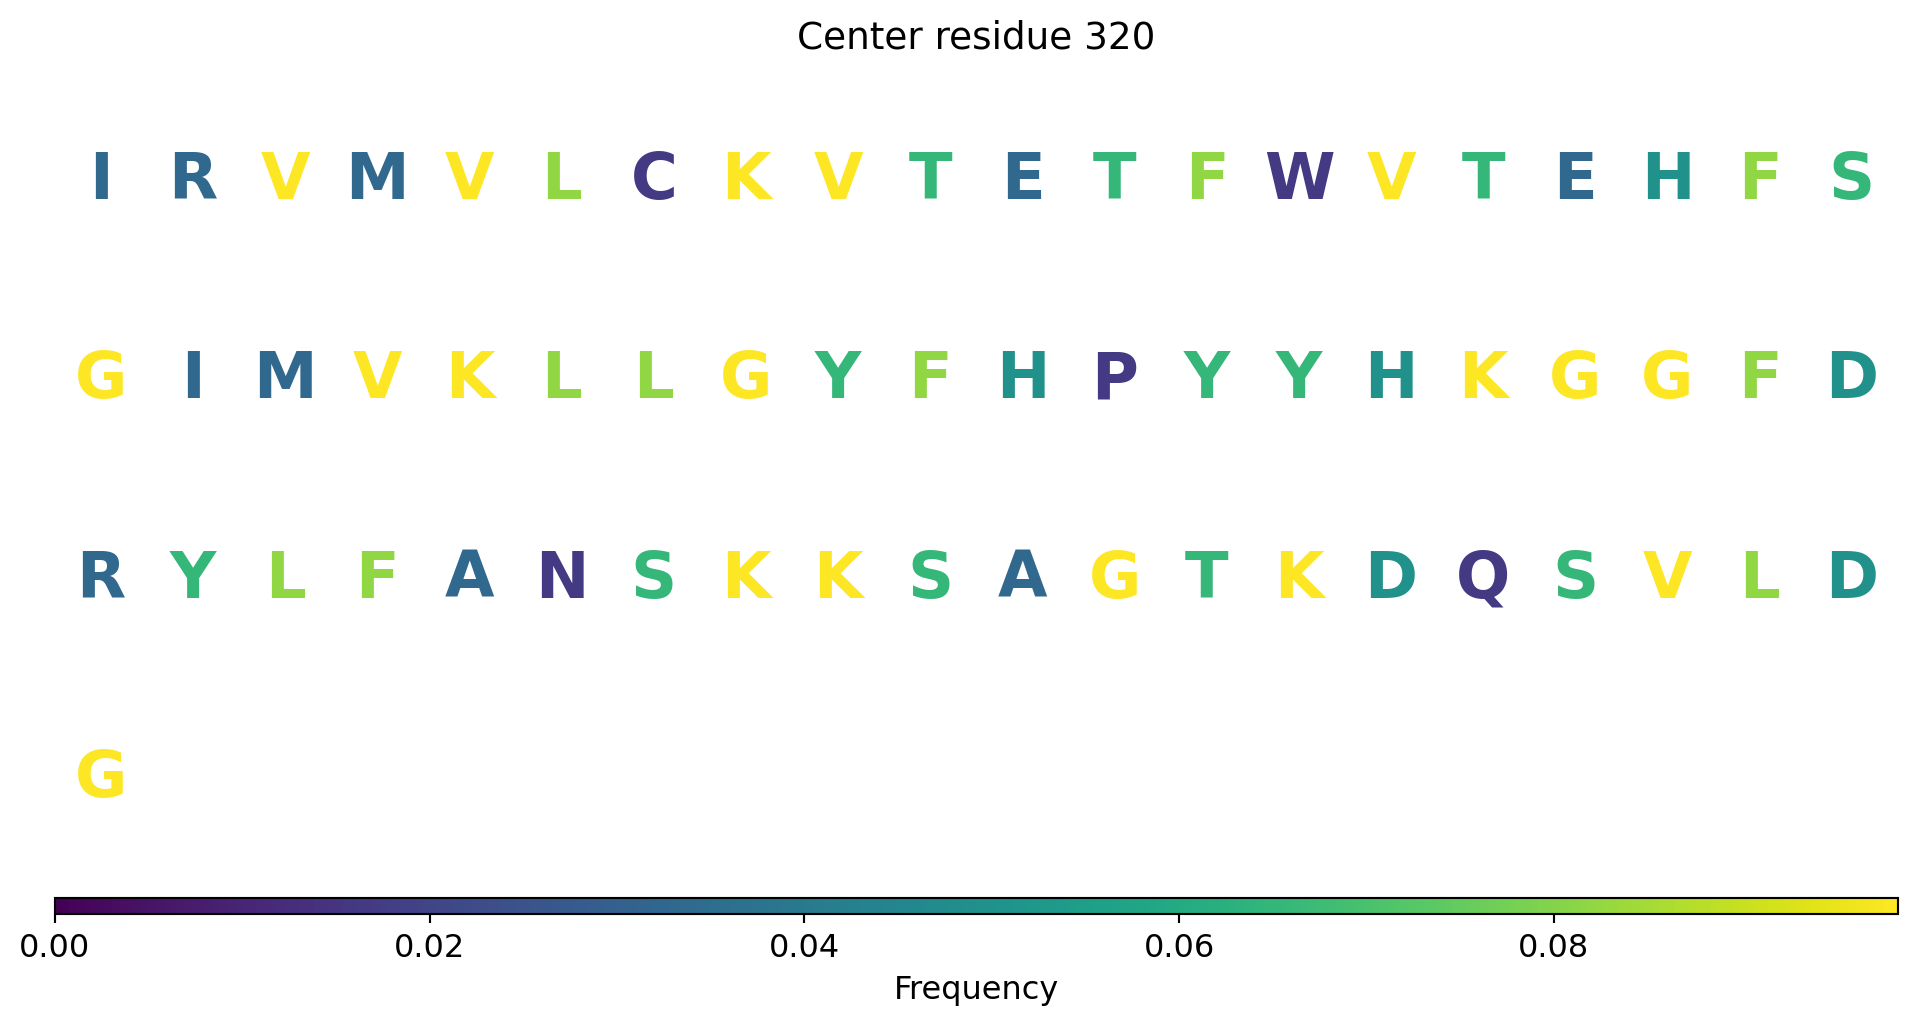
Surface representation - binding sites
The computed point cloud for pLDDT > 0.6. Each atom is sampled on average by 10 points.
To see the predicted binding interfaces, you can choose color theme “uncertainty”.
Go to the “Controls Panel”
Below “Components”, to the right, click on “…”
“Set Coloring” by “Atom Property”, and “Uncertainty/Disorder”