import requestsimport urllib3urllib3.disable_warnings()def fetch_uniprot_data(uniprot_id): url =f"https://rest.uniprot.org/uniprotkb/{uniprot_id}.json" response = requests.get(url, verify=False) # Disable SSL verification response.raise_for_status() # Raise an error for bad status codesreturn response.json()def display_uniprot_data(data): primary_accession = data.get('primaryAccession', 'N/A') protein_name = data.get('proteinDescription', {}).get('recommendedName', {}).get('fullName', {}).get('value', 'N/A') gene_name = data.get('gene', [{'geneName': {'value': 'N/A'}}])[0]['geneName']['value'] organism = data.get('organism', {}).get('scientificName', 'N/A') function_comment =next((comment for comment in data.get('comments', []) if comment['commentType'] =="FUNCTION"), None) function = function_comment['texts'][0]['value'] if function_comment else'N/A'# Printing the dataprint(f"UniProt ID: {primary_accession}")print(f"Protein Name: {protein_name}")print(f"Organism: {organism}")print(f"Function: {function}")# Replace this with the UniProt ID you want to fetchuniprot_id ="P43003"data = fetch_uniprot_data(uniprot_id)display_uniprot_data(data)
UniProt ID: P43003
Protein Name: Excitatory amino acid transporter 1
Organism: Homo sapiens
Function: Sodium-dependent, high-affinity amino acid transporter that mediates the uptake of L-glutamate and also L-aspartate and D-aspartate (PubMed:20477940, PubMed:26690923, PubMed:28032905, PubMed:28424515, PubMed:7521911, PubMed:8123008). Functions as a symporter that transports one amino acid molecule together with two or three Na(+) ions and one proton, in parallel with the counter-transport of one K(+) ion (PubMed:20477940). Mediates Cl(-) flux that is not coupled to amino acid transport; this avoids the accumulation of negative charges due to aspartate and Na(+) symport (PubMed:20477940). Plays a redundant role in the rapid removal of released glutamate from the synaptic cleft, which is essential for terminating the postsynaptic action of glutamate (By similarity)
More information:
AlphaFold model
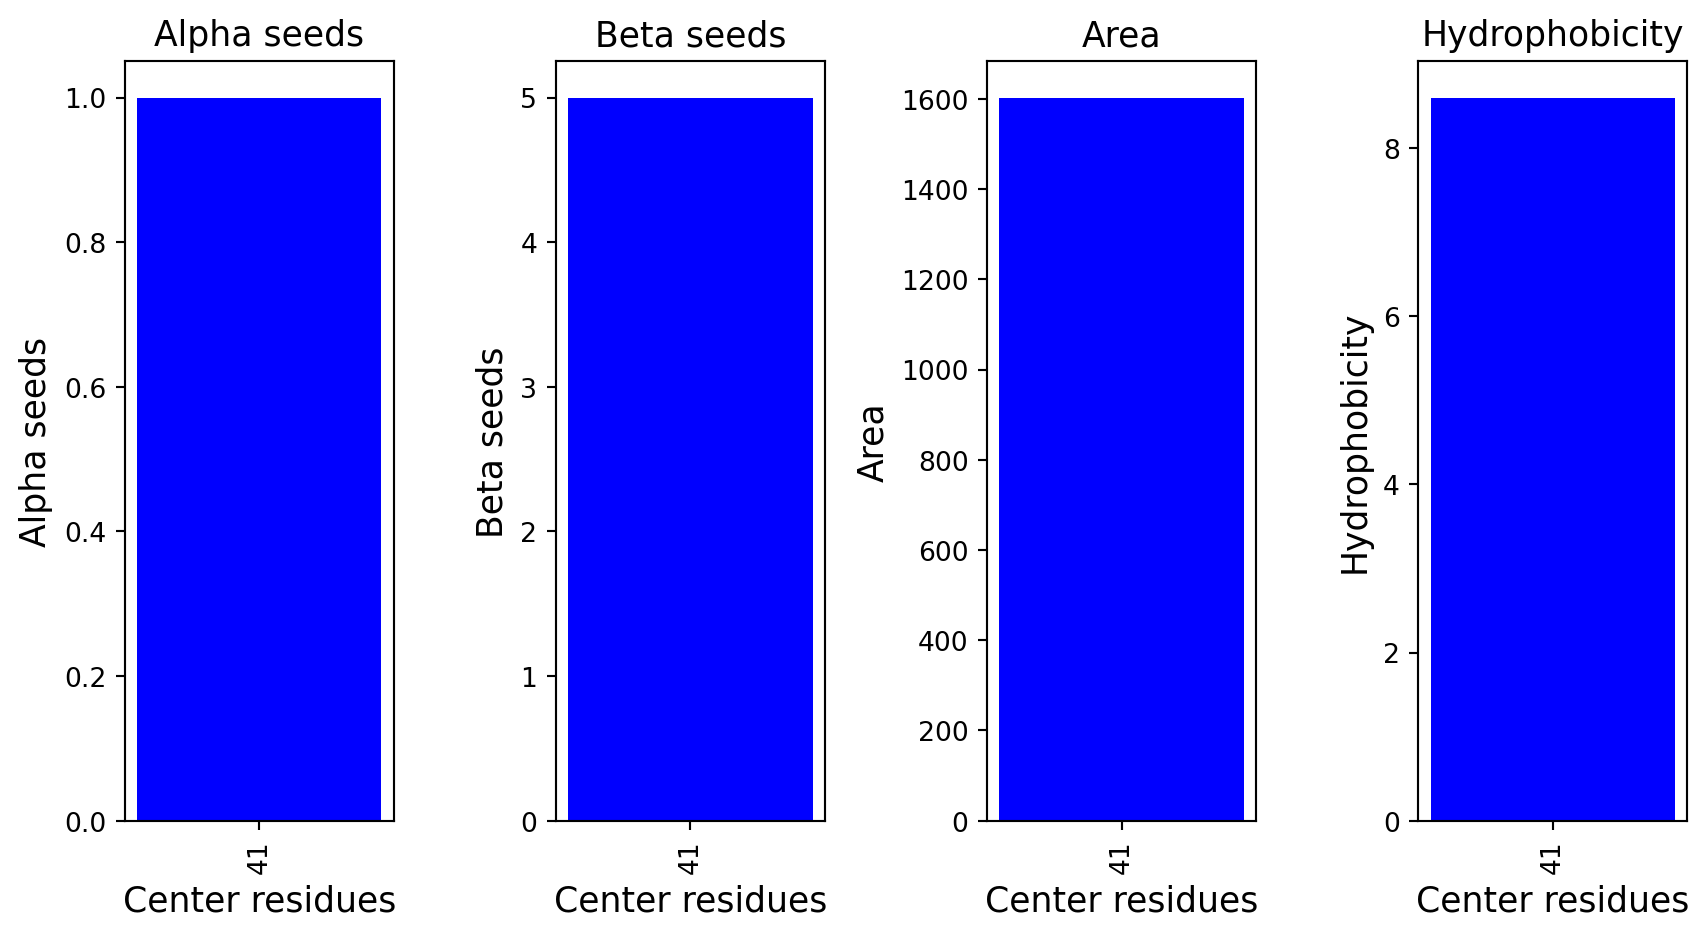
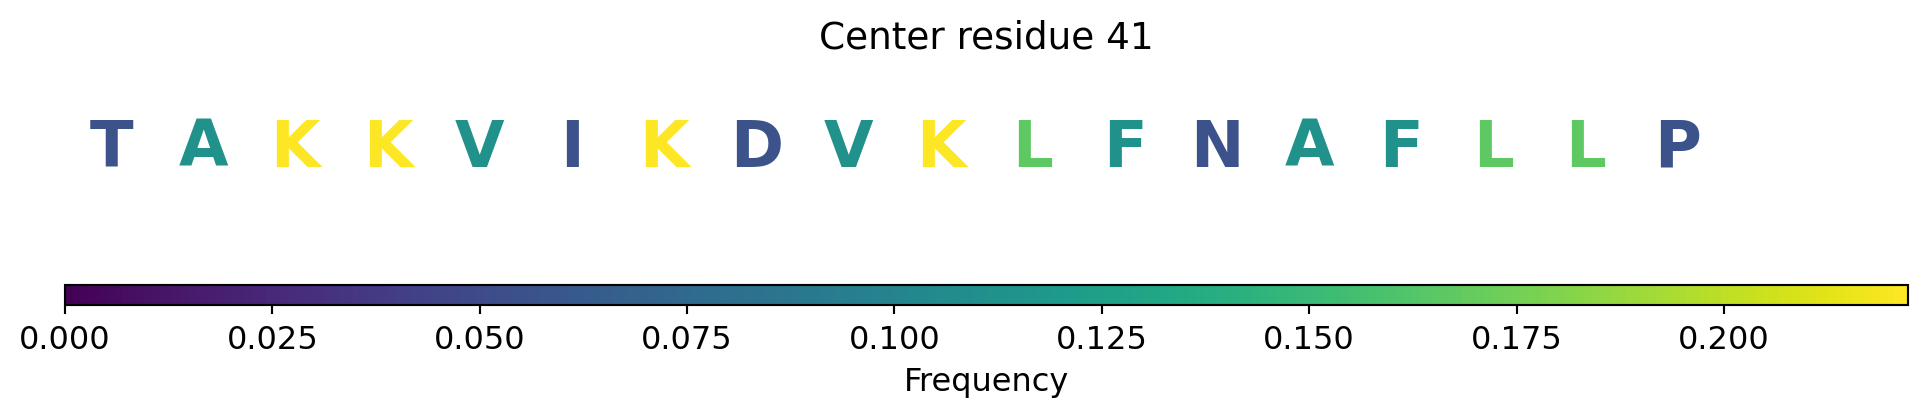
Surface representation - binding sites
The computed point cloud for pLDDT > 0.6. Each atom is sampled on average by 10 points.
To see the predicted binding interfaces, you can choose color theme “uncertainty”.
Go to the “Controls Panel”
Below “Components”, to the right, click on “…”
“Set Coloring” by “Atom Property”, and “Uncertainty/Disorder”